
If you run services in production, you already know that hope is not a strategy. Systems fail, networks hiccup, and containers crash. The difference between a minor blip and a catastrophic outage usually comes down to two things: Monitoring and Observability.
While these terms are often used interchangeably, they serve distinct architectural purposes:
- Monitoring tells you when something is broken. It is the dashboard showing a spike in CPU or an alert pinging your phone when a server goes down.
- Observability lets you ask why it is broken. It is the practice of instrumenting your systems—gathering metrics, logs, and traces—so you can debug novel, unforeseen problems from the outside in.
A mature stack provides both. You want active probing to ensure your services are reachable, alongside deep system metrics to diagnose bottlenecks.
In this post, we will walk through deploying a comprehensive, Docker-based observability stack. If you want to jump straight into the code, you can find the complete configuration in my GitHub repository: ObservabilitySolution.
Architecture at a Glance
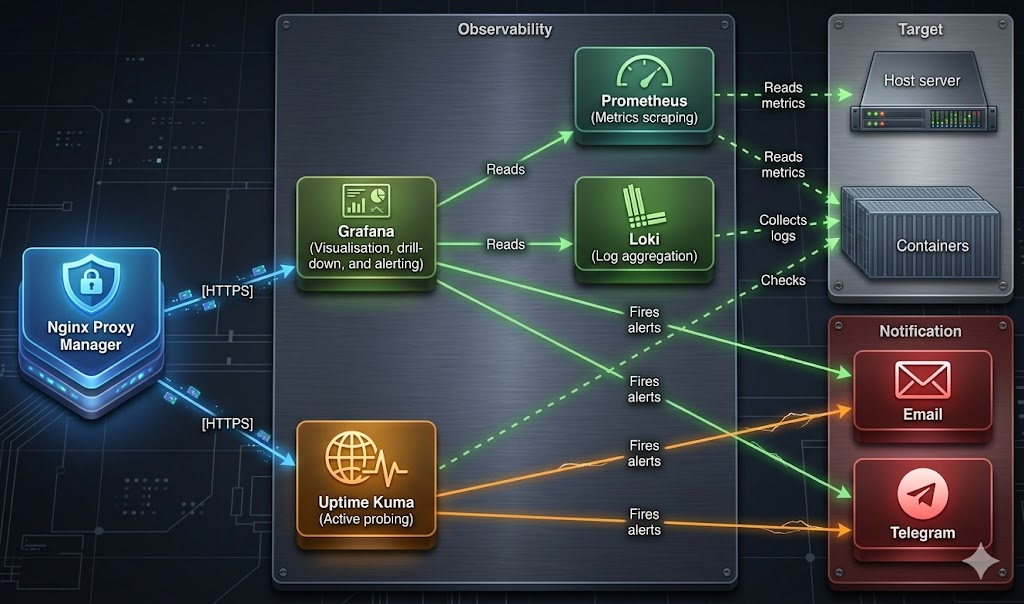
Before we dive into the deployment, let’s map out how these components interact. We are building a stack that handles internal metrics (Prometheus), log aggregation (Loki), external health checks (Uptime Kuma), and visualisations/alerting (Grafana).
1: Establish the Notification Engine (Telegram)
An alert is useless if nobody sees it. Before spinning up containers, we need a reliable communication channel. Telegram is excellent for this because its API is blazingly fast and easy to integrate.
The Key Actions:
- Message @BotFather on Telegram to create a new bot and secure your unique Token.
- Crucially, Disable Privacy Mode for the bot. This allows it to read messages and interact within group chats.
- Add the bot to a dedicated alerting group and grab the Chat ID (using
@userinfobotor the Telegram API). Keep a note of the minus sign (-) in the ID; it is important for groups!
2: Deploy the Core Stack (Grafana, Prometheus, Loki)
With alerting primed, we move to the heavy lifters. Instead of manually configuring UI settings later, we rely on a .env file to pass our SMTP and Telegram credentials directly into the deployment script.
2.1: Telegram quirk
Grafana’s internal YAML un-marshalling has a habit of coercing numeric strings into integers. Because Telegram group IDs are negative numbers (e.g., -123456789), this conversion can crash the integration. Our setup.sh script bypasses this by generating a telegram.yml file with literal values baked in, bypassing Grafana’s environment variable expansion entirely.
- Copy your
.env.exampleto.envand populate your Grafana admin passwords, SMTP details, and Telegram credentials. - Run the provided
./setup.shscript.
Architectural Tip: The setup script is not just a wrapper for
docker compose up. It validates your environment variables, ensures correct directory ownership, downloads community dashboards, and bakes your Telegram configuration directly into the Grafana provisioning files. Critically, it also takes care of a problem with Grafana munging Telegram environment variables.
Run docker compose ps to ensure all six containers in the stack report as running and Prometheus targets are up.
3: Active Probing with Uptime Kuma
Prometheus is fantastic for internal metrics but you also need synthetic monitoring to answer: “Can a user actually reach the login page?“.
Deploy Uptime Kuma using the 2.x branch (which is why the image is tagged next and not stable). We explicitly mount the Docker socket as read-only, allowing Uptime Kuma to check container health status without access to manipulate the host’s Docker daemon.
4: Secure the Perimeter (DNS & Reverse Proxy)
Never expose your monitoring tools on raw IPs or unencrypted HTTP ports. We use Nginx Proxy Manager (NPM) to route traffic cleanly and handle SSL termination.
The Key Actions:
- Map your DNS A Records (e.g.,
grafana.yourdomain.comanduptime.yourdomain.com) to your server IP. - In NPM, forward these domains to ports
3000and3001respectively. - Enable Block Common Exploits, Websockets Support, and force SSL/HTTP2 via Let’s Encrypt.
A quick curl -I https://grafana.yourdomain.com should now return a secure HTTP/2 200 response.
5: “Alerts as Code”
One of the most powerful features of this setup is that Grafana’s alerting is entirely provisioned as code. No clicking through menus to set up CPU thresholds; the rules load automatically on startup.
Our setup provisions:
- Host Alerts: High CPU, Memory, and critical Disk Space limits.
- Container Alerts: Restart loops and downtime.
6: Wire up Uptime Kuma
Finally, log into Uptime Kuma and point it at your services. Because all our containers share a proxy Docker network, Uptime Kuma can route via internal container names (e.g., http://grafana:3000) rather than bouncing out to the public internet and failing due to Docker routing rules.
Set up standard HTTP monitors for your endpoints, and configure Docker Container monitors for your critical infrastructure. Tie both to your previously configured SMTP and Telegram notification channels.
Remember Kuma is tagged with next, not stable!
Wrap-Up
By following these steps, you have transitioned from a reactive posture to a proactive one. You now have deep visibility into host and container metrics, log aggregation for debugging, and active probing to monitor end-user experience—all tied to an instant alerting pipeline.
Don’t forget to test your alerts by pointing a monitor at a broken URL to ensure your Telegram integration fires correctly.
For the full setup scripts and configuration files, head over to the ObservabilitySolution repository.